-
-
Par MasonDavis le 27 Octobre 2021 à 15:40
In the Forex market, each trader can choose a strategy that suits him exactly according to the type of character, experience, volume of the deposit and other factors. Medium and long-term trades bring good profits, but if you don't want to wait, switch to scalping. Let's take a look at a simple strategy in the MetaTrader terminal.
Usually, "scalping" is called transactions lasting 3-5 minutes on a minute timeframe. In our strategy, "scalping" will be making a small profit, the transaction is not limited in time. It can be closed by both Take Profit and trader.
Strategy characteristics
Type: Trend
Timeframe: Any in the range M1-M5. In our case, M1 is used, but with an increasing period of analysis, the accuracy of the signal increases.
Trading asset: Any currency pairs. The main requirement is a fixed (2-3 points) spread and no hidden fees.
Trading time: All Forex trading sessions.
Recommended Take Profit: 30-40 points
The strategy uses two technical indicators from the basic set of MetaTrader:
- Three exponential (EMA) averages with periods of 10, 20 and 50. Determine the direction of the short-term and medium-term trend. On a flute with high volatility, you can use a price channel within which you can trade (at least 10-15 points wide). A breakdown of the channel will signal a new trend. This method is only recommended for experienced traders!
EMA (20) and EMA (50), respectively, will be the "middle" and "slow" moving average, which determine the direction of the trend; EMA (10) will be the "fast" and the first signal to open a new deal.
- MACD (6, 12, 9). This indicator works both as a trend and as an oscillator instrument, so it will be the final signal to open order.
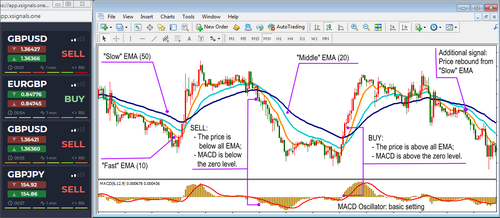
Trading signals:
- BUY. The price is above all EMA. MACD is above the zero level.
- SELL. The price is below all EMA, MACD is below the zero level.
The signals are simple, but beginners should definitely wait for confirmation of a trend or price reversal from the MACD. We trade orders for a rebound from only 3-5 candles after its start, we are sure to wait for a downward reversal of all EMA.
You can watch the video with the strategy on the YouTube channel
 votre commentaire
-
Par MasonDavis le 10 Juin 2021 à 08:09
ADX indicator is created to identify the moment to open the option. If you want to know how to use this indicator to identify the options trading signals, apply the “Medium Direction Strategy". This strategy was created by the American trader Wilder how also developed RSI and Parabolic SAR.
ADX indicator is characterized by high delay. The computing of data twice smooths the Moving Average, most part of the market noise will be deleted. This delay will be especially strong during the flat period.
This indicator will suit those who prefer to trade long and medium-term trading.
Graphically ADX is shown in three binary options charts in a separate window:
The + DI line shows the positive direction (increment) of the price.
Negative in –DI.
ADX is calculated as the ratio of the difference or the sum of + DI/-DI values over a specified number of periods. In this way, you can identify the trend.
This is how the ADX indicator looks like on the graph.

If you want to know more about how to use ADX to identify the best free trading signals for binary options, watch this video.
votre commentaire
-
Par MasonDavis le 21 Mai 2021 à 13:20
“Neptune” is the perfect strategy for scalping with the best free binary options signals. This strategy includes three indicators. You can find this indicator on any option trading signal service.
Bollinger Bands (BB). This indicator shows the volatility of the market.
EMA. This indicator shows the moment to open the transaction. These moments happen on the BB intersections and or on the rollbacks from its borders.
Awesome Oscillator (AO). AO confirms the signals of the previous indicators.
Characteristics of the strategy
Binary option trading signals:
Up (CALL)-option. Price and EMA transit the middle of BB from down to up or rollback from its edges. AO histogram is green, above or as close to zero as possible.
Down (PUT)-option. Price and EMA cross the middle line of the BB from the up to down or struggling its upper limit. AO histogram of red color, below or near the zero level.
Avoid trading 30 minutes before and after the publication of the market news. If the broker provides the possibility to close the trade until the expiration of the signal. Remember that the binary option trading signals can be obtained only with the qualitative trading software.Watch the video about this strategy
votre commentaire
-
Par MasonDavis le 20 Avril 2021 à 14:07
This method was developed by the trading expert Alexander Elder. “Triple Screen” strategy uses the data from three timespans: long, medium, and small. According to the Elder, each timespan should be at least five times longer than the previous one. The main principle is simple: open the position on M1 when the trend is the same on all timespans.
Strategy
Start the evaluation from the higher timespan, then move to the average and to the five-minute ones. Here you can identify even the 30 second binary options. Use the Stochastic to erase the false signals. This oscillator shows the balance between bulls and bears. If the predictor is above level 80, it is the end of the uptrend. If it is below 20, that means the end of the downward. Monitor the chart attentively and try to use only the best binary options software.
Binary options signals
CALL option. The uptrend for all timespans. Stochastic is above zero levels or in the overbought zone.
PUT option. Opposite situation. The downtrend for all timeframes. Stochastic goes down to the oversold zone.
If you want to see how to apply this strategy, follow the link and watch the video.
votre commentaire Suivre le flux RSS des articles de cette rubrique Suivre le flux RSS des commentaires de cette rubrique
-
option trading signal binary strategy binary time trading strategy binary options signals trading signal options signals day trading fast indicator strategy with how vfxalert signals option trading binary options trading binary signals binary option this how to make money can binary options trading signals binary options adx trading for beginners identify trading signals
 Voir tous les tags


